Your Entire Intake Pipeline — One Screen
The LitiGator Dashboard is a real-time web app that lives inside your Google Workspace. No separate login, no third-party analytics tool. Open a URL, see everything: your personal caseload, firm-wide analytics, reviewer activity, case details, and system health.
Built for the person who needs to know what’s happening across the firm’s intake — without opening a spreadsheet.
Why It Matters
- See your personal pending cases and the firm’s full pipeline at a glance
- Identify aging cases before they become problems
- Track reviewer activity, response times, and conflict status across your team
- Monitor system health without checking logs manually
- Export data to CSV for reporting or compliance
- Merge duplicate contacts with one click
Six Tabs, Zero Clutter
The dashboard is organized into six tabs: My Dashboard, Firm Overview, Cases, Reviewers, People, and System. My Dashboard is your personal landing page; Firm Overview gives the big-picture analytics; the remaining tabs drill into specific areas. The System tab is admin-only.

My Dashboard
Your personal landing page. Everything about your caseload in one scroll.
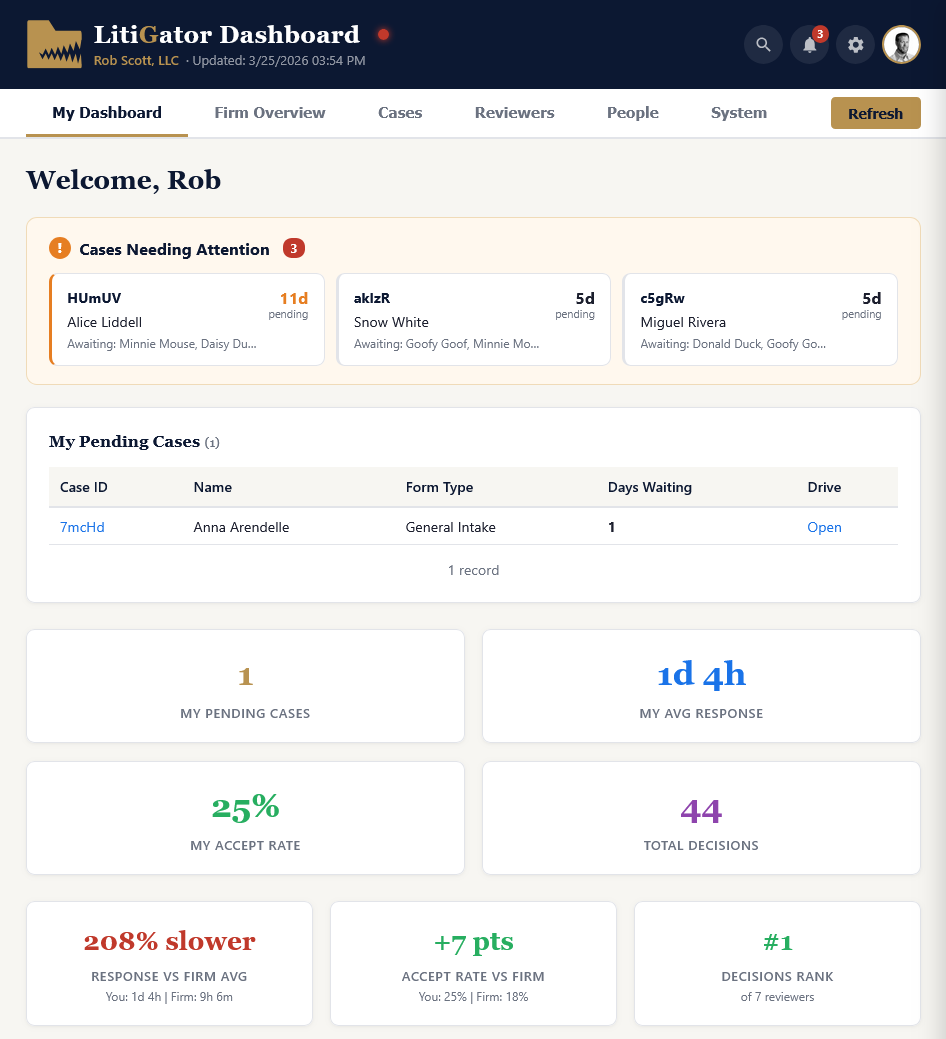
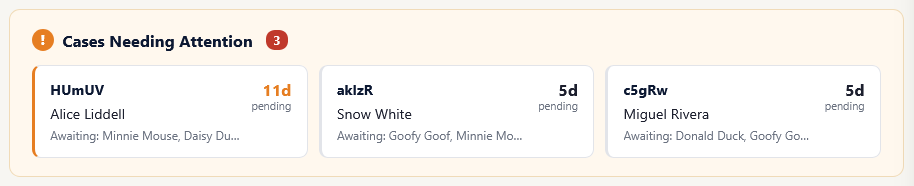
Welcome & Attention Banner
A personalized greeting at the top, followed by an inline amber banner showing cases that need your attention — pending cases you haven’t reviewed yet, aging cases, and nudge-worthy items. Each card opens the case detail panel when clicked.
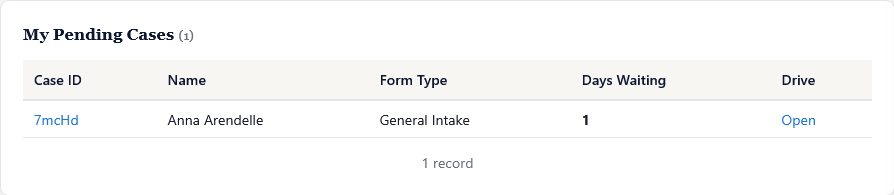
Pending Cases Table
Cases waiting for your review, sorted by urgency. Click any row to open the full case detail panel.
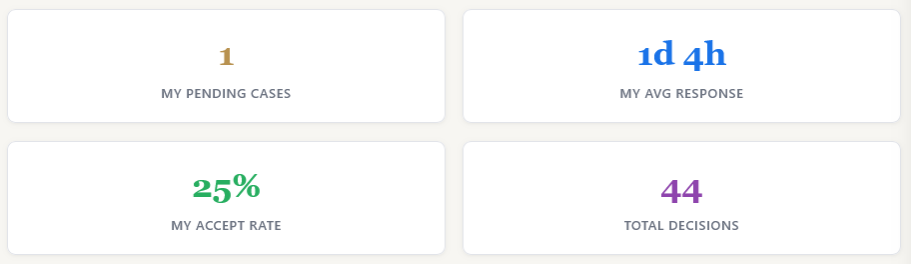
Personal KPI Cards
Your personal stats: cases reviewed, accepted, declined, acceptance rate, and average response time. These reflect your individual activity, not the firm’s totals.
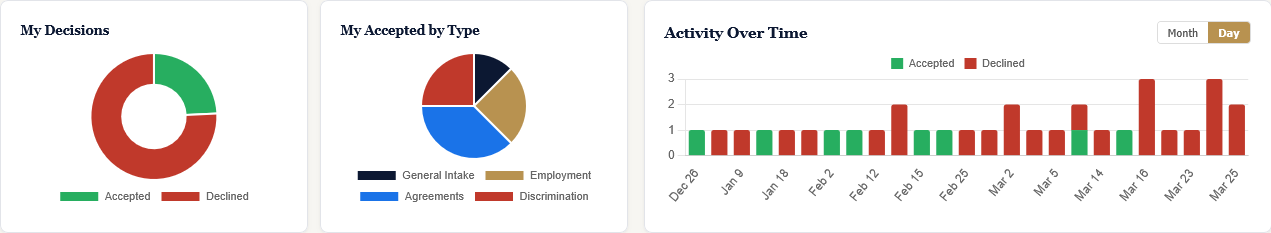
Personal Charts
Three charts on one row: My Decisions (accept/decline breakdown), My Accepted by Type (pie chart of accepted cases by form type), and My Activity (decisions over time).
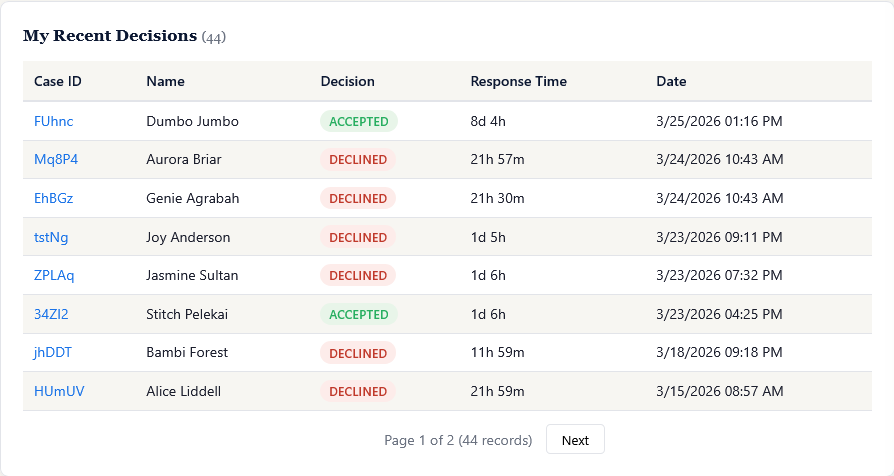
Recent Decisions
Your last 15 decisions with case ID, client name, your vote, response time, and timestamp. Quick reference for what you’ve acted on recently.
Firm Overview
The big-picture analytics tab. Firm-wide KPIs, charts, decision logs, and attorney performance — everything the managing partner or admin needs.
Quick Filters
One-click preset filters across the top: Last 7 Days, Last 30 Days, Last 90 Days, Pending, Accepted, Declined. Custom date ranges via date pickers. Filters apply to all charts and tables on this tab.

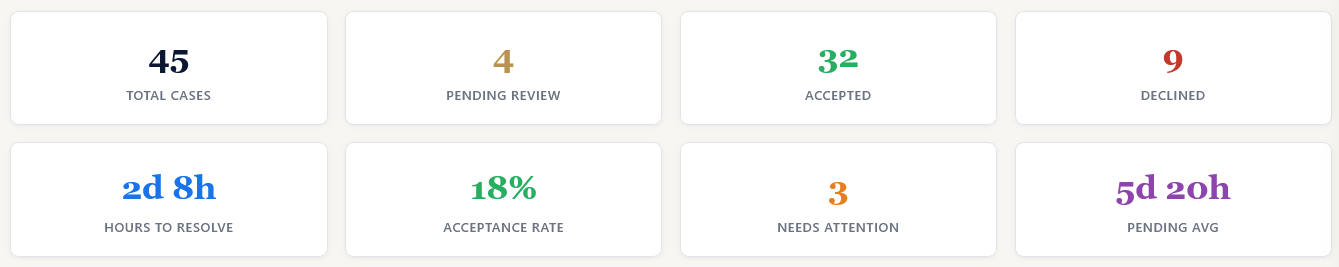
Firm KPI Cards
Firm-level stats: Total Cases, Pending Review, Accepted, Declined, Hours to Resolve (average), Acceptance Rate, Needs Attention, and Pending Average (how long current pending cases have been waiting). Color-coded so you can scan in seconds.
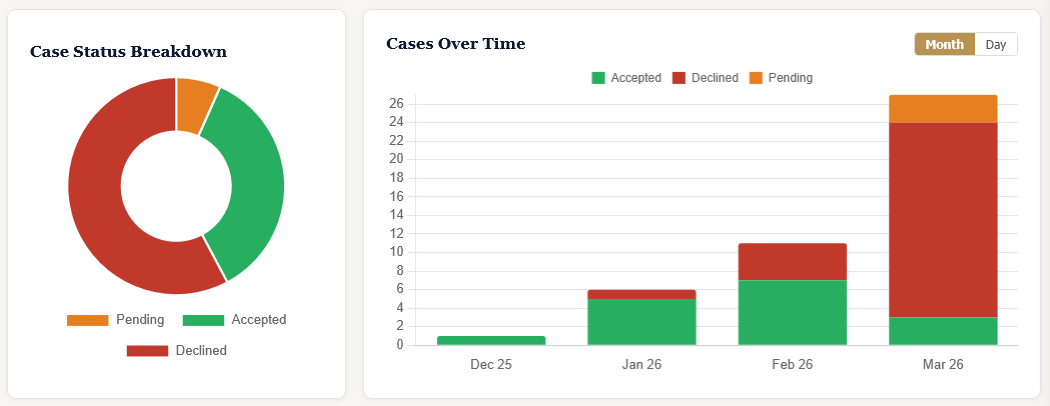
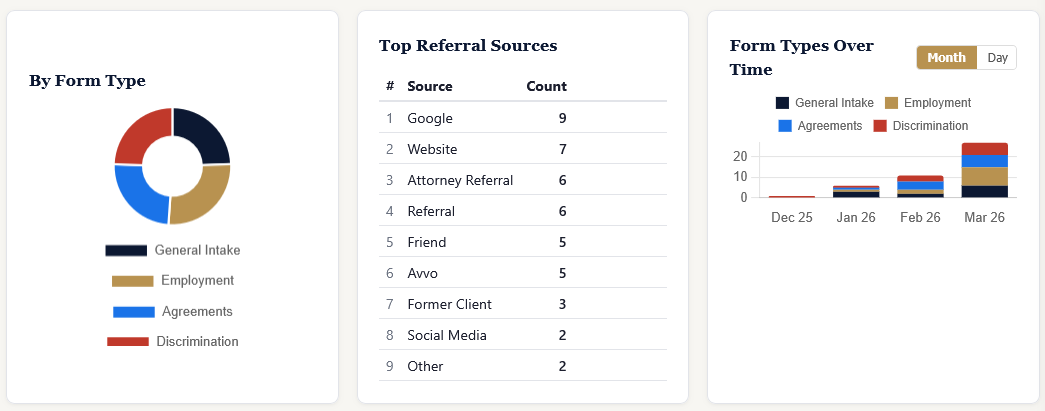
Firm Charts
Five charts across two rows: Case Status doughnut, Cases Over Time stacked bar, Form Type Distribution, Referral Source breakdown, and Form Types Over Time. A sixth chart — Status by Intake Type — appears in its own section below.
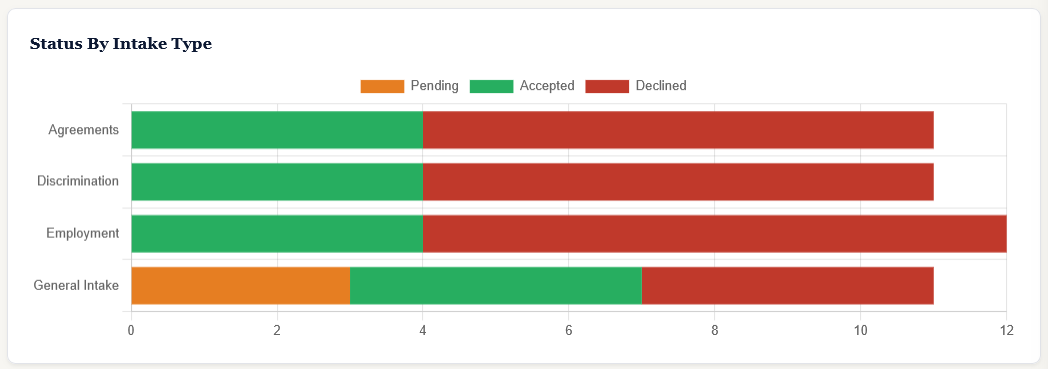
Status by Intake Type
A horizontal stacked bar chart showing the pending/accepted/declined breakdown for each form type. Instantly see which practice areas have the most pending work.
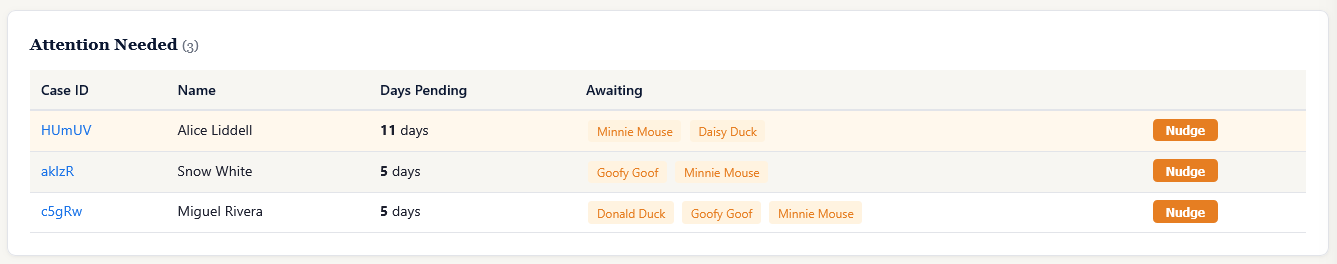
Attention Needed
A table surfacing cases that have been pending with no attorney decision. Each row shows the case, how long it’s been waiting, which reviewers haven’t responded yet, and a Nudge button to send a reminder.
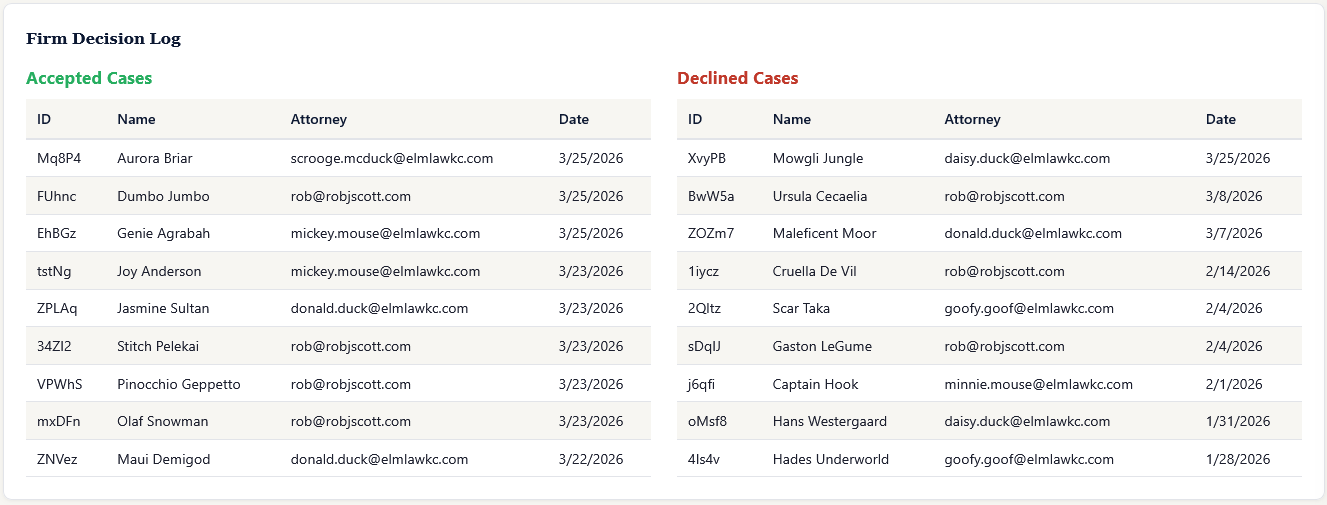
Firm Decision Log
Split into Accepted and Declined tables, each paginated. Shows every firm-level decision with case ID, client name, reviewer who acted, and timestamp. Full audit trail at a glance.
Attorney Stats & Review Split
An Attorney Stats table showing each attorney’s accepted and declined counts as proportional bars, plus conflict counts, accept percentage, average speed, and backlog. Below it, an Attorney Review Split horizontal stacked bar chart showing Pending, Declined, Accepted, and Conflict segments per attorney.


Cases Tab
Full Case Table
Every case in your system, sortable and searchable. Columns include Case ID, client name, adverse party, form type, status badge, submission date, days open, and a Drive folder link. Paginated at 25 rows per page.

Case Detail Panel
Click any Case ID to open a slide-out panel on the right side of the screen. On the Cases tab, the panel shows the full case summary including contact information, intake form fields, and decision history. From other tabs, it shows a quick overview with key details and status.
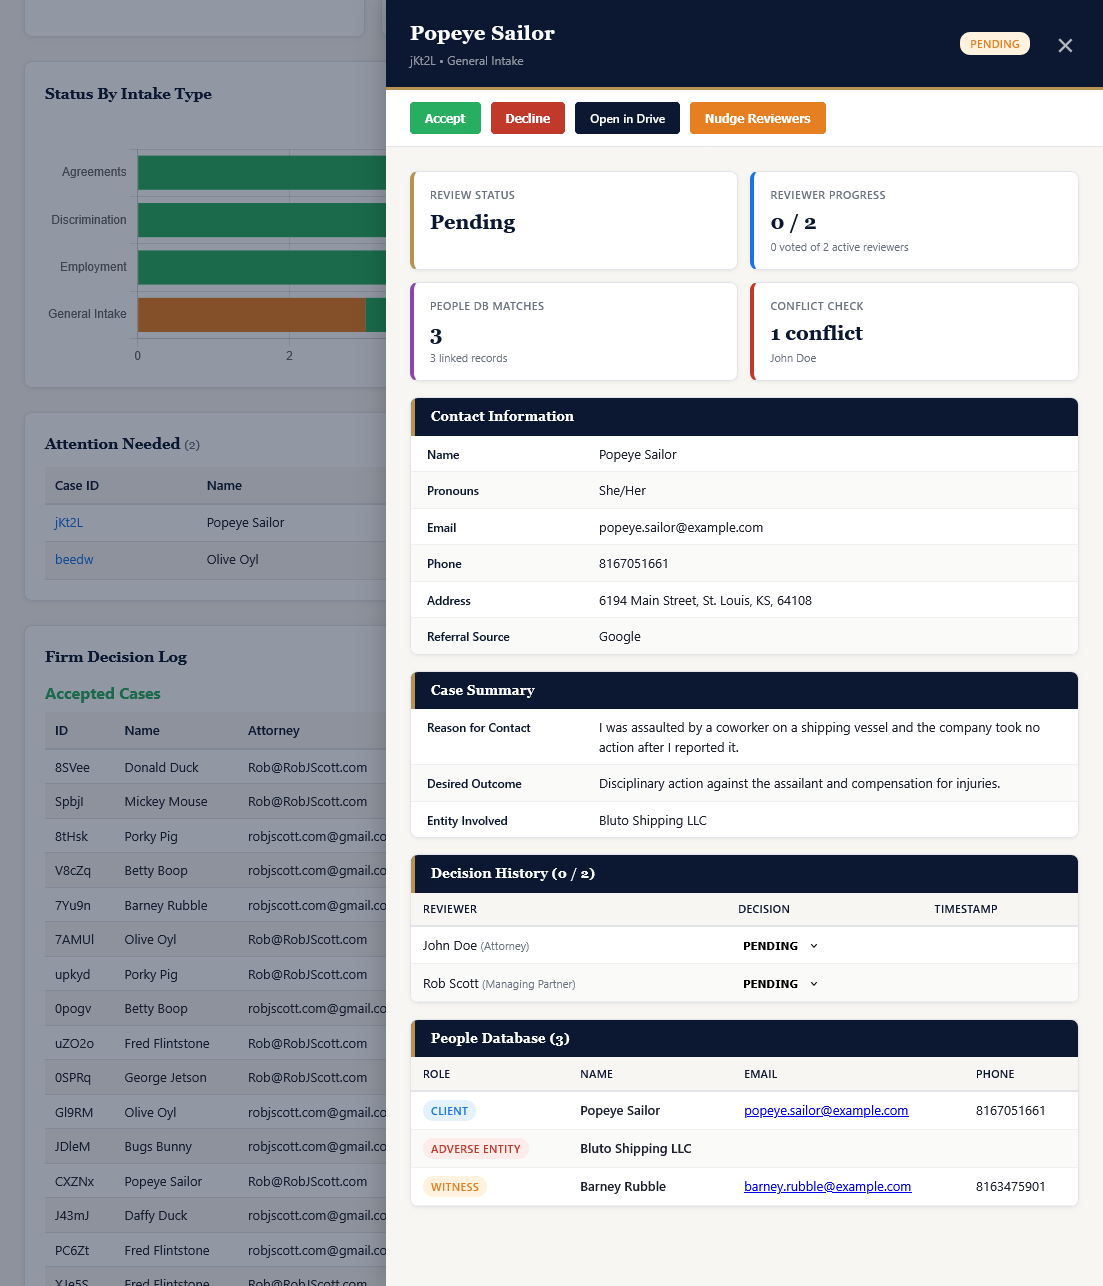
Per-Reviewer Nudge
Pending cases show a Nudge button next to each non-responsive reviewer in the Decision History table. Send a targeted reminder to a specific reviewer directly from the panel.
Conflict Detection
When a reviewer has a personal conflict with the case’s adverse party, the panel shows it. Conflicted reviewers are automatically excluded from voting, and the Reviewer Progress card deducts them from the eligible total.
Decision Heatmap
A color-coded grid showing every reviewer’s decision on every case. Green = accepted, red = declined, purple = conflicted out, hatched gray = case was resolved before they voted. Paginated at 25 rows. At a glance, you can see patterns: who responds quickly, who tends to decline, which reviewers are conflicted out, and which cases had split decisions.

CSV Export
The Export CSV button downloads every case (respecting your current search/filter), not just the current page. Ready for compliance reporting, partner meetings, or your own analysis.
Reviewers Tab
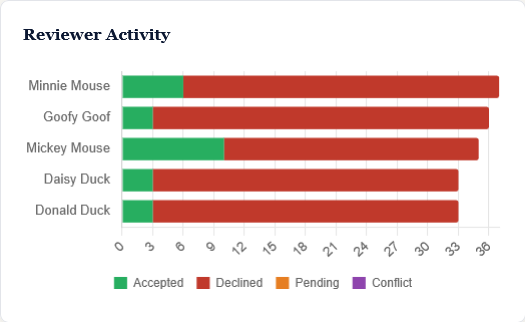
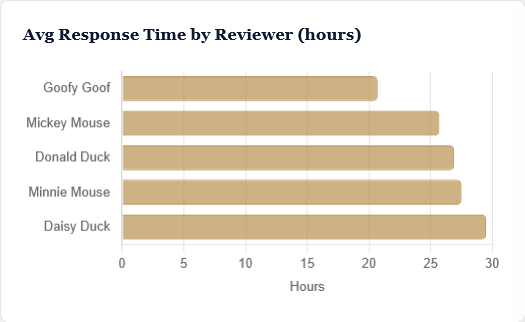
Reviewer Activity & Response Time Charts
Two charts: a Reviewer Activity stacked bar showing accepted/declined/pending/conflict decisions per reviewer, and an Average Response Time bar showing how long each reviewer takes to respond. Instantly see who’s carrying the load and who’s slowest to act.
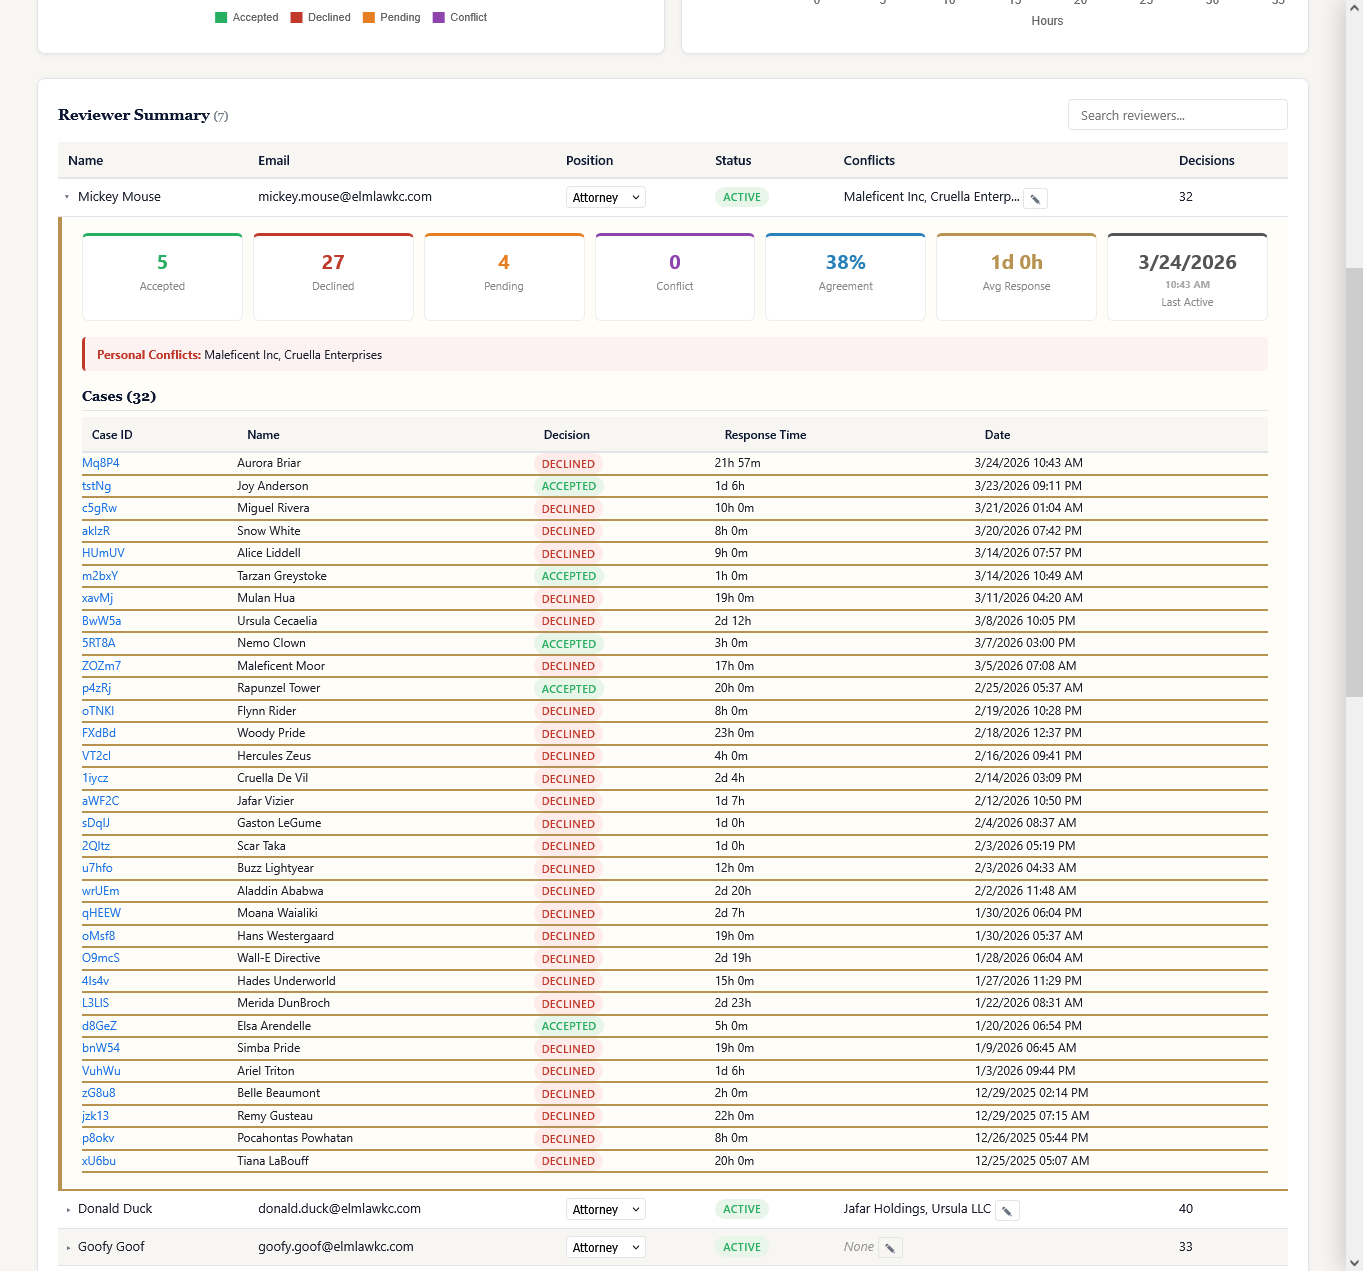
Reviewer Summary Table
Every reviewer listed with name, email, position (Attorney, Partner, Admin, or Paralegal), active/inactive status badge, and total decisions. Admins can toggle status, change positions via dropdown, and edit conflicts inline. Click any reviewer to expand their detail panel with personal KPIs, conflict list, and full case history.
People Tab
Two sub-tabs: Contacts and People Database.
Contacts
A deduplicated view of every person across all intakes. Each contact shows name, role badge (Client, Adverse Entity, Witness), email, phone, linked cases, and first seen date. Searchable, sortable, exportable to CSV, and paginated. Click any contact to expand full details and associated cases.

Merge Duplicates
Select duplicate contacts with the checkboxes, click Merge Selected, and they collapse into a single record with all phone numbers, cases, and history preserved. A confirmation dialog previews the merged result before you commit. No data lost.


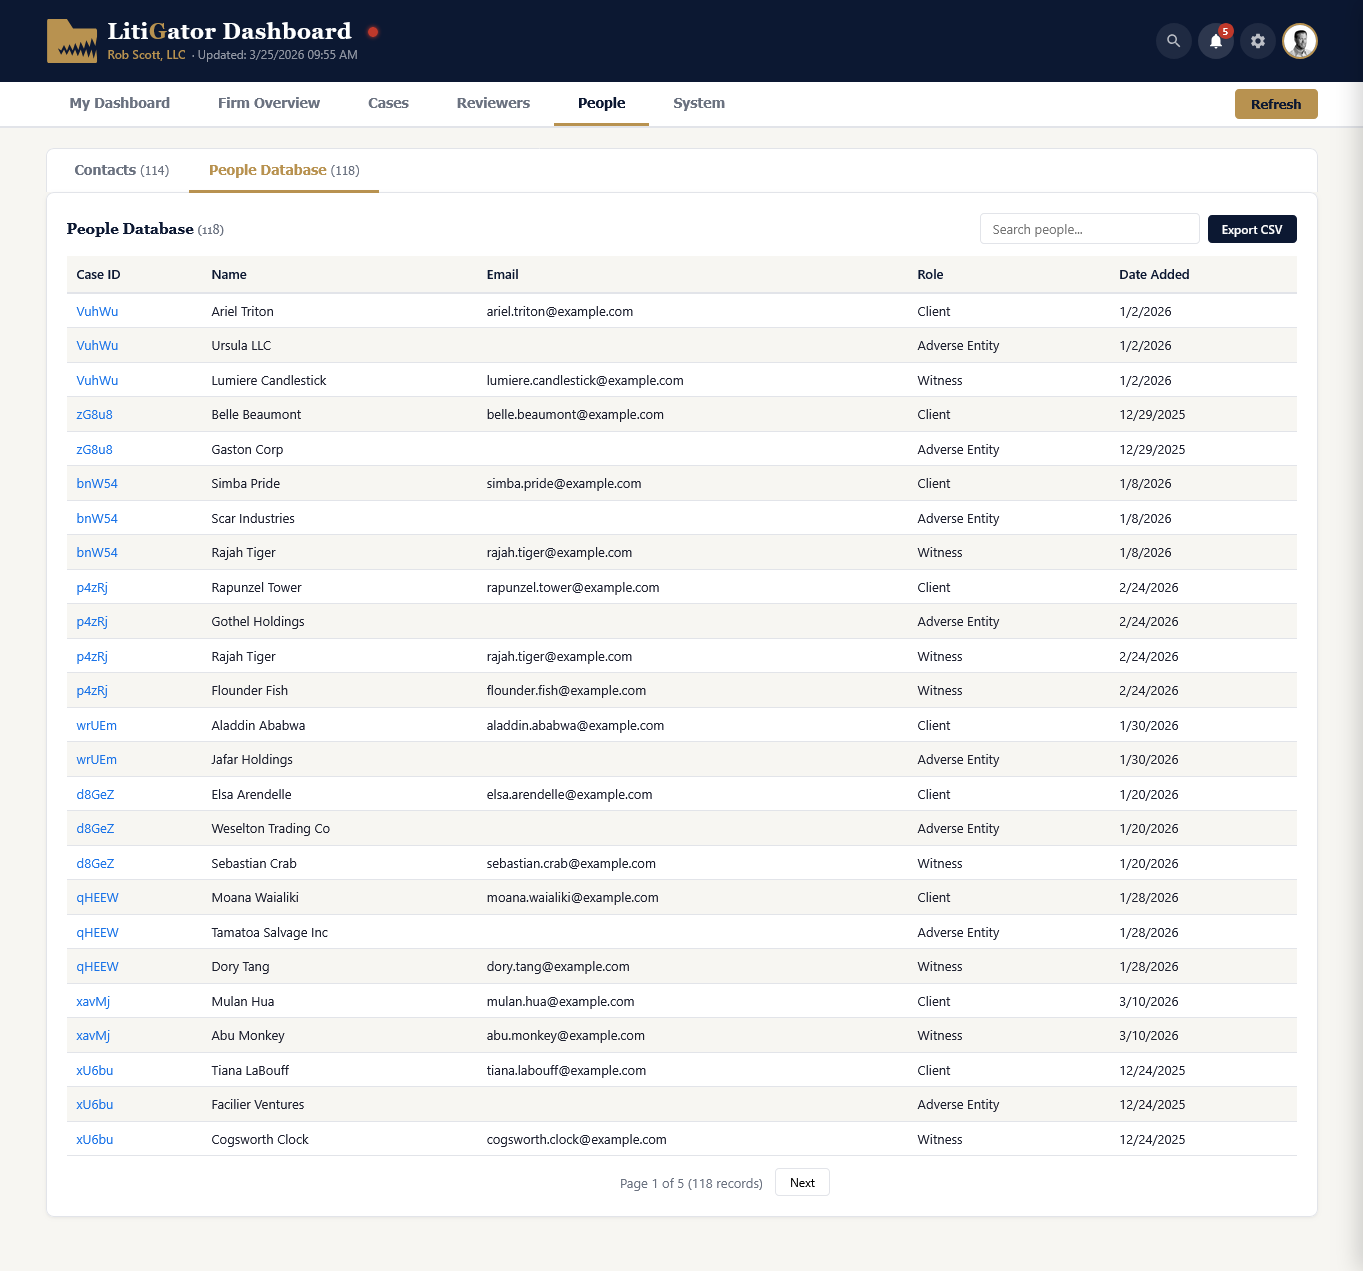
People Database
The raw People Database — every individual record as harvested from each intake. Shows Case ID, name, email, role, and date added. Searchable, paginated, and exportable to CSV.
System Tab
Admin-only. Non-admin users won’t see this tab.
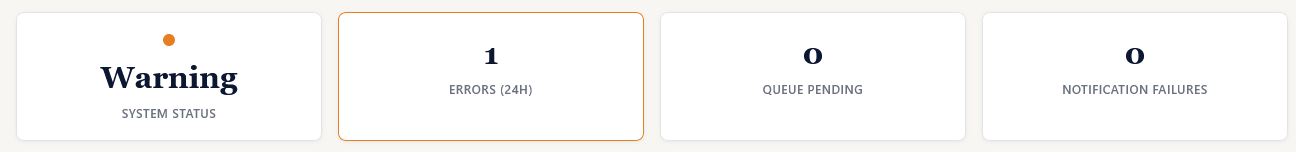
System Health Cards
Four cards with color-coded status: System Status (green/yellow/red based on 24-hour error count), Errors in Last 24 Hours, Queue Pending (items waiting to process), and Notification Failures. Green means all clear. Red means investigate.
Queue & Notification Summaries
Two summary cards: Queue Status Breakdown (Pending, Processing, Complete, Error counts) and Notification Status (Failed and Dead Letter counts). Quickly identify webhook processing issues or email delivery failures.
System Status Indicator
A colored dot next to the dashboard title provides instant system status visible from any tab. Green: all clear. Yellow with a glow: minor issues detected. Red with a pulse animation: needs attention.
System Logs Table
The last 200 system log entries, newest first. Each row shows timestamp, level (color-coded badge: ERROR in red, WARNING in orange, INFO in blue, SUCCESS in green), category, message, and associated case ID. Searchable and paginated.

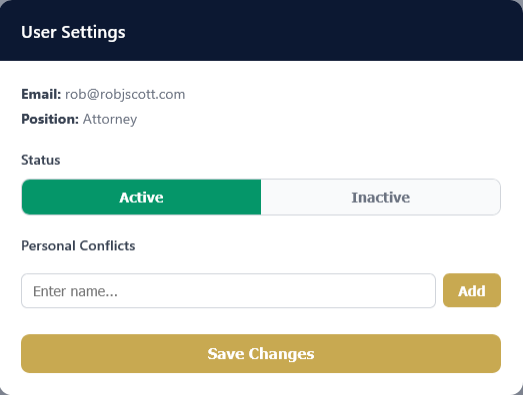
User Settings
Click the gear icon in the toolbar to open the Settings panel. From here you can view your email and position, toggle your Active/Inactive status, and manage personal conflicts. When Inactive, you won’t receive new case notifications or be included in voting rounds.
Key Details
- No separate login — runs as a Google Apps Script web app inside your Workspace
- Real-time data — reads directly from your spreadsheet on each load; hit Refresh anytime
- Case ID links — click any Case ID to open the Google Drive folder for that case
- Four reviewer positions — Attorney and Partner (voting), Admin and Paralegal (non-voting), with two access levels (Reviewer and Admin)
- Conflict detection — reviewers with personal conflicts are automatically excluded and shown as greyed out in case panels
- Per-reviewer nudge — send targeted reminders to specific non-responsive reviewers from the Decision History table
- Slide-out case panel — click any Case ID for full case details without leaving the current page
- CSV export — available on Cases, Contacts, and People Database tabs
- Contact merging — select duplicates, merge to one record, all data preserved
- Decision Heatmap — visual grid of every reviewer’s decision on every case, with purple cells for conflict exclusions
- Mobile responsive — tabs scroll horizontally, KPI cards stack, tables scroll horizontally on small screens
- Same URL as webhook — the dashboard (GET) and intake webhook (POST) share the same Apps Script deployment